
From a Crowded Platform to an Agent-Based Model
For the final assignment of the Santa Fe Institute’s Introduction to Agent-Based Modeling course, I decided to build a model of passenger behavior on a subway platform. The idea came from personal experience observing how a busy Montreal metro station reacted to service disruptions and how passengers behaved while waiting for service to resume. As trains became less frequent, passengers continued to arrive, the platform grew progressively more crowded, and some people eventually decided to leave the station and find another way to reach their destination.
This situation is well suited to agent-based modeling because its overall behavior emerges from the interactions of many individual elements. Passengers arrive at different times, prefer different waiting locations, respond differently to crowding, and may eventually leave the station. At the same time, trains arrive with limited remaining capacity, and passengers board through several doors. No single factor determines whether the platform clears; the outcome depends on how all these processes interact over time.
The resulting Subway Platform Simulator represents passenger accumulation, spatial waiting behavior, train boarding, and service disruptions on a single platform. It explores how passenger demand, train capacity, waiting preferences, crowd sensitivity, and willingness to use another transportation mode influence platform occupancy and service recovery. The central question became whether a given combination of conditions produces a stable or unstable regime. In a stable regime, arriving trains can repeatedly clear most of the accumulated demand, and platform occupancy returns toward a normal level. In an unstable regime, the backlog persists or grows, sometimes remaining high even after train service has returned to normal.
The model deliberately represents one platform rather than an entire subway line or network. It does not simulate individual passenger destinations or transfers between lines. This limited scope made it possible to concentrate on the interaction at the heart of the project: how individual passenger decisions and train operations jointly shape congestion and recovery on a subway platform.
Building the Subway Platform Simulator
The model contains two types of agents: passengers and a train. The passengers represent individuals waiting on the platform, while a single train agent is reused to represent successive trains arriving at the station. The platform itself is represented by NetLogo patches divided into waiting zones, with markers identifying train-door locations and two staircases at opposite ends.
Passengers arrive according to a Poisson process, a commonly used approach for representing independent arrivals over time. The passenger-arrival-rate input controls the average number of passengers attempting to enter during each tick, while the actual number varies randomly. The platform has a comfort capacity of 200 passengers but can continue accepting arrivals until it reaches a maximum occupancy of 260. Any additional passengers are recorded as refused entries.
Each passenger is assigned a set of individual characteristics. These include sensitivity to crowding, willingness to leave the station and use another transportation mode, a possible preference for waiting near a train door, and a possible preference for remaining close to the staircase through which they entered. These characteristics vary across passengers, allowing the model population to behave heterogeneously rather than as a uniform crowd.
When entering, passengers select a waiting location according to their preferences. Staircase proximity takes precedence over door proximity when a passenger has both preferences. Other passengers choose locations elsewhere on the platform. Passengers then periodically evaluate the crowding in their current waiting zone. A passenger who becomes uncomfortable first looks for a less crowded location that still satisfies their original preference. If no such location is sufficiently comfortable, the passenger temporarily abandons that preference and moves to one of the least crowded zones.
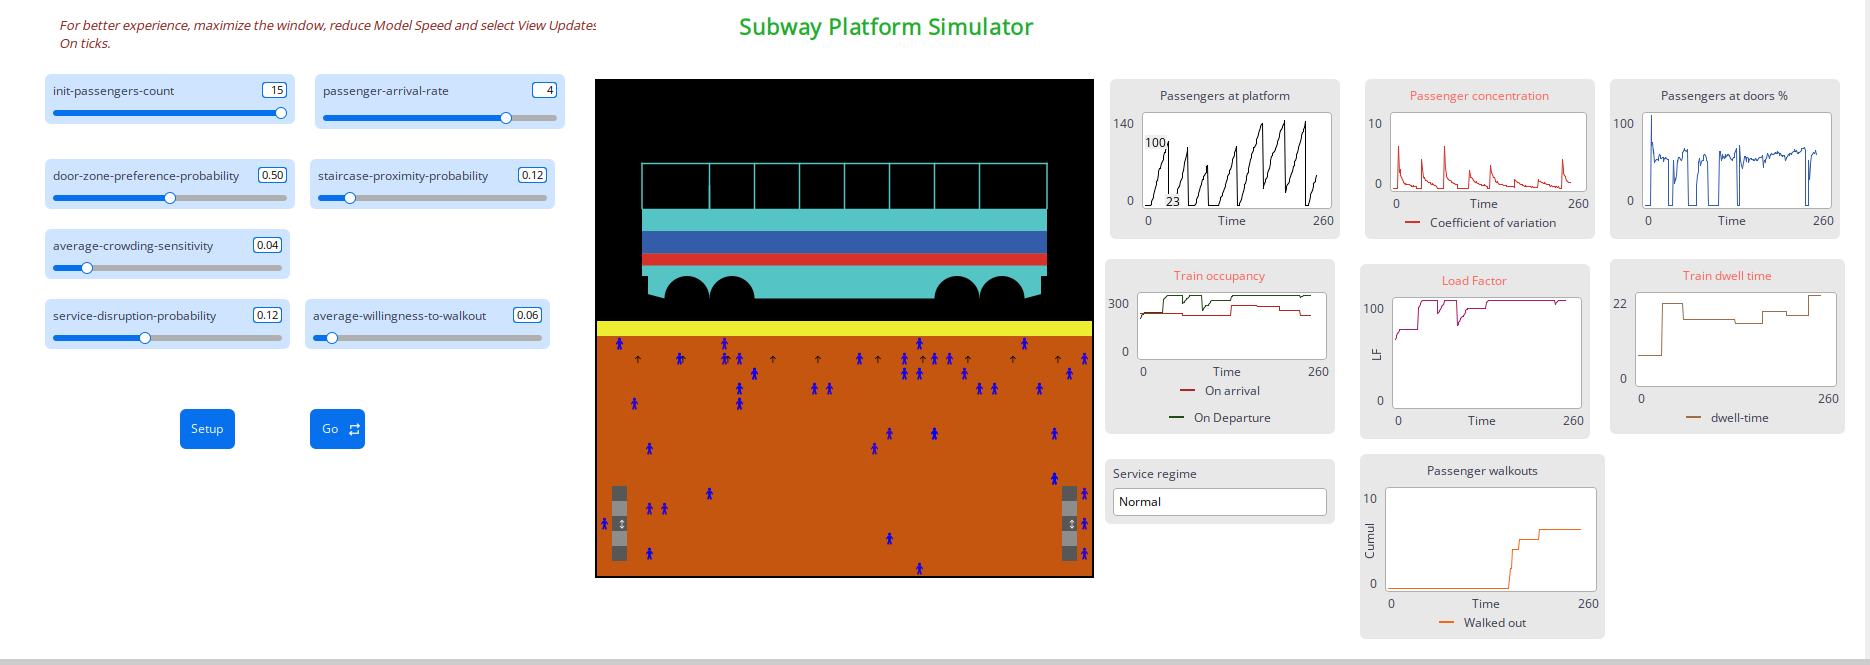
The train follows a two-state cycle: it is either away or dwelling at the platform. At each arrival, the model determines the train’s initial occupancy and the number of onboard passengers who alight. Waiting passengers are then selected for boarding until everyone has boarded or the train reaches its capacity of 300 passengers. Once its dwell time has elapsed, the train departs, returns to the away state, and schedules the next arrival.
Dwell time depends not only on how many passengers board but also on where they are waiting. Each boarding passenger is assigned to the nearest train door. Passengers farther from a door contribute more boarding workload, and the door with the largest total workload determines the boarding time. This provides a direct connection between the spatial organization of the crowd and train operations.
Service disruptions introduce additional uncertainty. A disruption delays the next train and causes trains to arrive more crowded, leaving less room for waiting passengers. Its severity decreases over a sequence of two to five affected arrivals before service returns to normal. During a disruption or severe overcrowding, passengers who have waited long enough may decide to leave the station. Their decision depends on their waiting time, personal willingness to use another mode, disruption severity, and platform occupancy.
Several simplifying assumptions kept the model focused and manageable. Passengers change waiting locations instantaneously instead of walking across the platform. Alighting passengers are represented by a count rather than as separate agents, preserving their effect on available train capacity without introducing another moving population. These abstractions allowed the model to concentrate on passenger accumulation, spatial choices, boarding, and recovery from disruptions.
When Passenger Behavior and Train Operations Interact
The most interesting behavior of the model comes from the interactions between passenger decisions and train operations. During normal service and at moderate passenger arrival rates, trains can usually transport the accumulated demand, and platform occupancy falls sharply after each departure. When demand becomes too high or train service is disrupted, this balance can break down.
A disruption affects the platform in two ways. First, the longer interval before the next train gives more passengers time to accumulate. Second, disrupted trains arrive more crowded and therefore have less capacity available for those waiting. Even after a train boards as many passengers as possible, a substantial number may be left behind. If subsequent trains cannot remove passengers as quickly as new ones arrive, the backlog persists.
Passenger distribution adds another layer to this interaction. Passengers waiting near train doors generally create less boarding workload. However, concentrating too many passengers around a small number of doors can overload those doors even when others are less busy. Similarly, passengers waiting far from the doors require more time to reach them. Because the busiest door determines the boarding component of dwell time, both excessive concentration and poor positioning can keep a train at the platform longer.
Passenger preferences help create these spatial patterns. Some passengers prefer to wait near doors, while others remain close to the staircase through which they entered. Crowding-sensitive passengers may relocate to less occupied areas, even if this requires temporarily abandoning their preferred location. The resulting distribution is therefore not centrally planned: it emerges from many passengers independently balancing convenience and comfort.
A particularly important distinction is the difference between operational recovery and platform recovery. A disruption ends when train service returns to its normal regime, but the passenger backlog created during the disruption may remain. Several additional trains may be needed to clear it, and another disruption can occur before this recovery is complete. Restoring the schedule is therefore not the same as restoring normal conditions on the platform.
Train boarding is also not the only mechanism that reduces the crowd. Passengers who have waited long enough may leave the station, especially when disruption severity or overcrowding is high. Once the platform reaches its maximum occupancy, new passengers are refused entry. Both mechanisms can make the platform queue decrease or stop growing, but neither means that the transit service successfully transported those passengers.
The colour of each passenger provides a visible indication of how these interactions unfold over time. New arrivals appear blue and gradually change through purple to red as their waiting time increases. During persistent congestion, a platform filled with red passengers reveals an aging backlog. After a train departs, the passengers left behind may be disproportionately those who have already waited the longest.
Experiments, Insights, and Where the Model Could Go Next
The simulator is designed as an experimental environment rather than as a prediction of conditions at a particular station. Its inputs make it possible to explore how passenger demand, service reliability, and individual behavior combine to produce different outcomes. Because many processes in the model are stochastic, the same configuration can generate different results across repeated runs. A scenario that remains stable once may become congested in another run, so conclusions should be based on patterns across multiple simulations.
One of the most interesting experiments is to search for the boundary between stable and unstable regimes. Starting with a moderate passenger arrival rate, the rate can be increased gradually until trains no longer clear the platform regularly. Repeating the experiment under different disruption probabilities shows how reduced service reliability shifts that boundary. Platform occupancy, train load factors, dwell times, walkouts, and refused entries help reveal how and why the transition occurs.
Other experiments focus on passenger behavior and spatial organization. Increasing the preference for waiting near train doors shows how passenger positioning affects door workloads and dwell time. Increasing staircase preference can pull passengers away from door areas, while greater crowd sensitivity encourages them to redistribute from crowded zones. The passenger-concentration coefficient and the percentage of passengers waiting near doors make these spatial effects measurable rather than merely visual.
The willingness to walk out can also be tested under congested conditions. When willingness is low, the platform may remain close to its maximum occupancy for long periods and repeatedly refuse new arrivals. When it is higher, walkouts may help the platform recover more quickly, although this apparent improvement comes at the cost of passengers abandoning the service. The experiment reinforces an important lesson from the model: lower platform occupancy does not necessarily indicate better service performance.
Several extensions could broaden the questions explored by the model. A first step would be to expand it from a single platform to an entire subway line. It could then be extended to a network containing interchange stations to examine how a disruption on one line propagates to other parts of the network. The current model implicitly represents a weekday morning rush hour with a constant average passenger arrival rate. A more realistic version could reduce that rate as the simulation progresses, reflecting the decline in arrivals after 9:00 a.m. Passengers could also decide whether to board a crowded train during a disruption or wait for the next one in the hope of having a more comfortable journey.
A further step would be to calibrate arrival rates, train occupancy, platform capacity, and dwell times using observed transit data. NetLogo’s BehaviorSpace could then be used to run systematic experiments across many combinations of passenger demand and disruption conditions. These experiments could support a formal measure of stability based on platform-occupancy trends, persistent overcrowding, or the time required for the platform to recover.
Building the Subway Platform Simulator showed me how agent-based modeling can connect individual choices with system-level outcomes. A passenger choosing where to wait or whether to leave may seem insignificant in isolation. When many passengers make such decisions while train capacity and service conditions change, however, recognizable patterns of congestion, recovery, and instability emerge.